Logic Analyzer and PulseView Setup
How to Measure External Digital Signals
Please Log In for full access to the web site.
Note that this link will take you to an external site (https://shimmer.mit.edu) to authenticate, and then you will be redirected back to this page.
Installation
In this page we'll go over the setting up of the logic analyzer and its supporting software. The software, called Pulseview, can be acquired here at the link below. Please download and install the appropriate version for your operating system. You can also use it on the lab machines (it is installed on all of them and is launchable by running pulseview in the terminal):
Apple M1, M2, and M3 users. It is highly likely that this software will not currently work on your computer. Instead, when needed, you should use the lab computers. You can log in on them with your MIT kerberos and ID number. PulseView can then be launched from the terminal
For Windows users, there are two options for running PulseView. Windows will not recognize the logic analyzer by default in PulseView (the menu to select a device will be empty). To fix this, one can either (1) use the Zadig tool to install the WinUSB driver for the device so that the Windows version of PulseView works, or (2) install the Linux version of PulseView on Ubuntu 24.04 in WSL by running:
sudo apt install pulseview
You will need to bind and attach the logic analyzer to Linux, which will
entail the same usbipd commands but with a different device ID. Then the
device should show up in the device menu in PulseView.
Once installed, in order to verify things are working, grab your logic analyzer. Depending on which one you got (they are functionally the same), it'll look like one of the following:

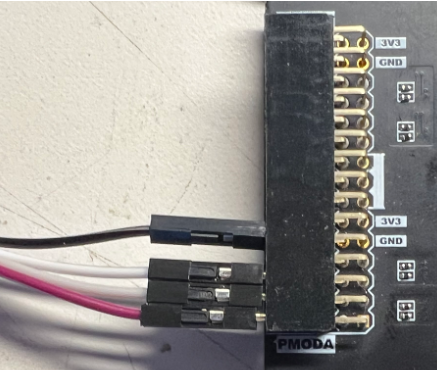
Plug your logic analyzer into the computer with PulseView installed. Attach the colored probes to the logic analyzer if they are not already connected. Then for testing, using some hookup wires, connect ground to GND on your FPGA and CH0-3 to the pins shown on the FPGA below:
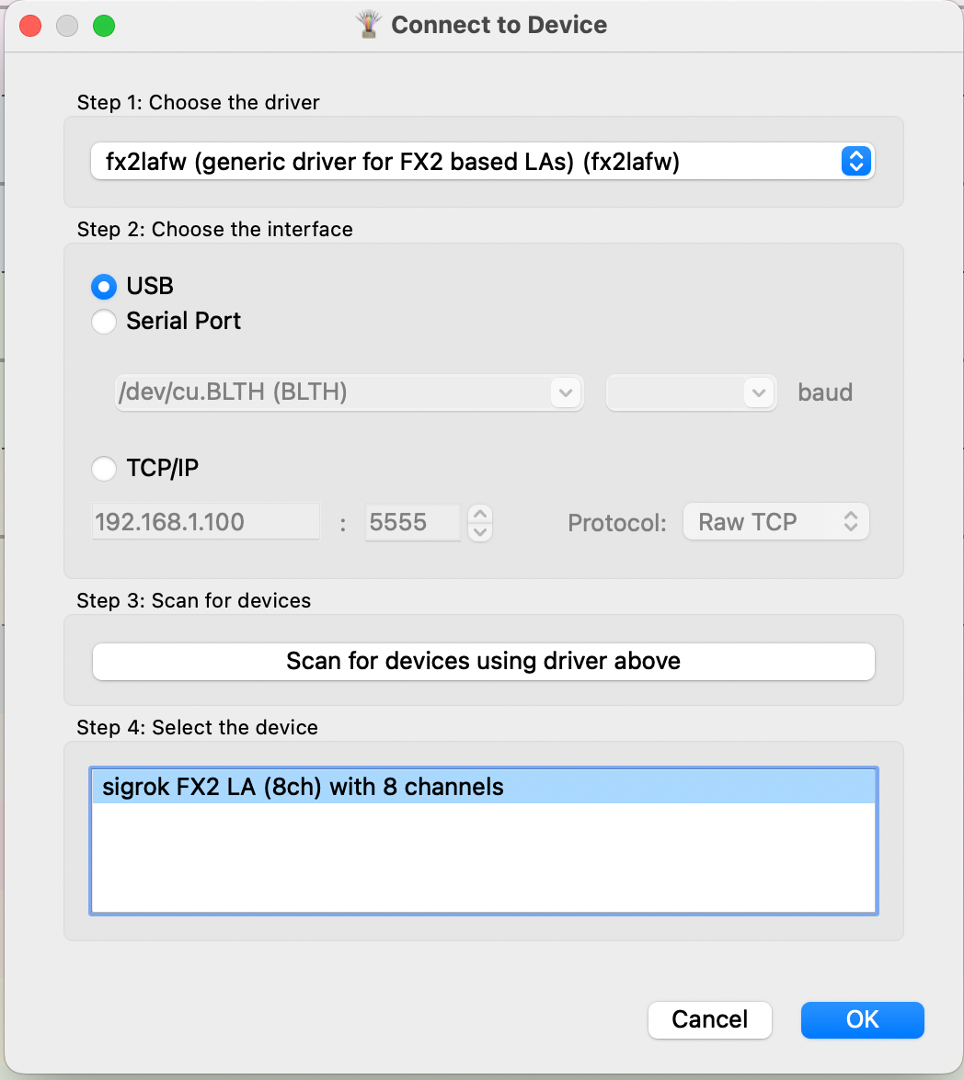
Open up PulseView. At the top of the window should be the device/driver selection. Find the one that says something related to "FX2". That is the general class of device our logic analyzer is.
Set your logic analyer to capture 1000 samples at a rate of 200kHz (top center of window). Press "Run" (top left) and chances are you should see some data appear, however it will most likely be all zeroes all the time since we're not giving it any signals now. Let's change that.
Take the same bitfile we tested the openFPGALoader with (or redownload it if you'd like: here), upload it to your FPGA. This bitfile presents three signals on the FPGA output pins we hooked up to:
- A steady 10 kHz clock at 50% duty cycle
- A pseudorandom 1 bit value changing at a rate of approximately 10kHz
- A signal that fires pseudorandomly and relatively rarely (approximately once per second on average,but)
Do another grab on your logic analyzer and if things are good, you should see something like below. The order may differ depending on which probe/channels got connected where, but the pattern roughly should be there.
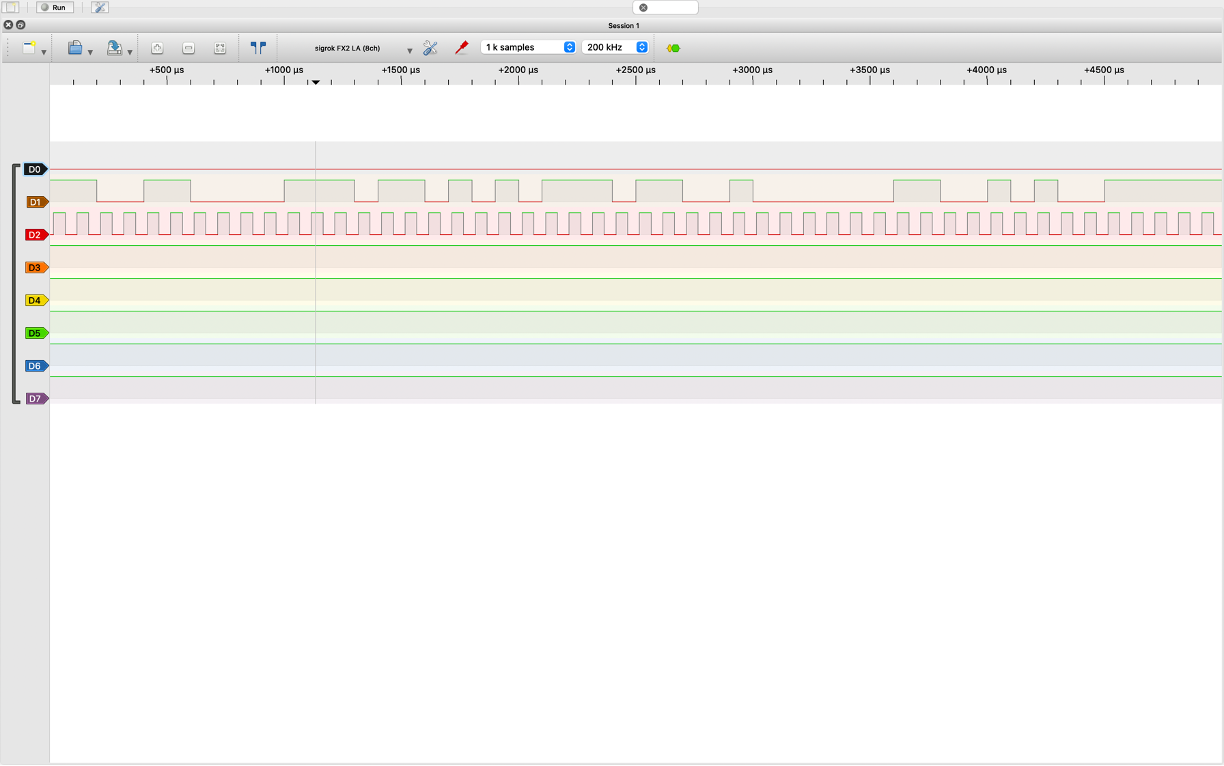
You can keep grabbing things by pressing "run" again and again. This is grabbing snapshots of your signals and displaying them at a rate much, much faster than you could ever measure just using your eyes or a volt meter or something. Often this is a helpful way to debug and measure signals, especially when deployed to hardware. Other times it can get annoying. What if you have an event that happens very rarely but you need to investigate with very high timing precision (like microsecond or sub-microsecond scale?) Just running and searching your results will rely on luck. And that's no fun. As an example of this, there's one more signal you likely didn't see be not 0 yet. One of those three wires will contain, there is a "rare" signa...something that appears only approximately every three seconds. We'd like to catch a glimpse of it.
This is where triggers come in. You can tell the logic analyzer to only capture and display data when a particular type of condition happens. On the channel that currently looks to be always off, click on it. What should pop up should be a little window with a few things in it, including several symbols. The "." just means no trigger, but the others are checking for when (in order shown) the signal is LOW, HIGH, Rising (0->1), Falling (1->0), and some value you specify (which is useful when lumping multiple channels together into multi-bit expressions.) Let's pick the rising edge trigger:
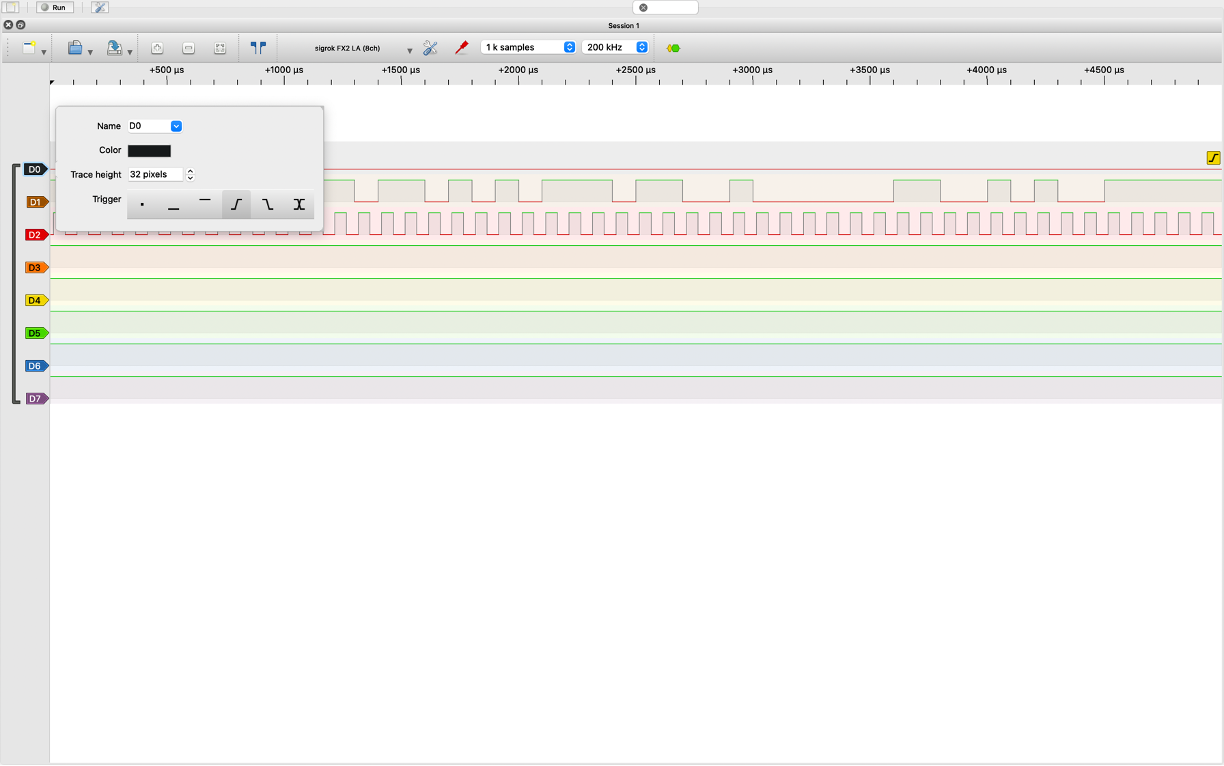
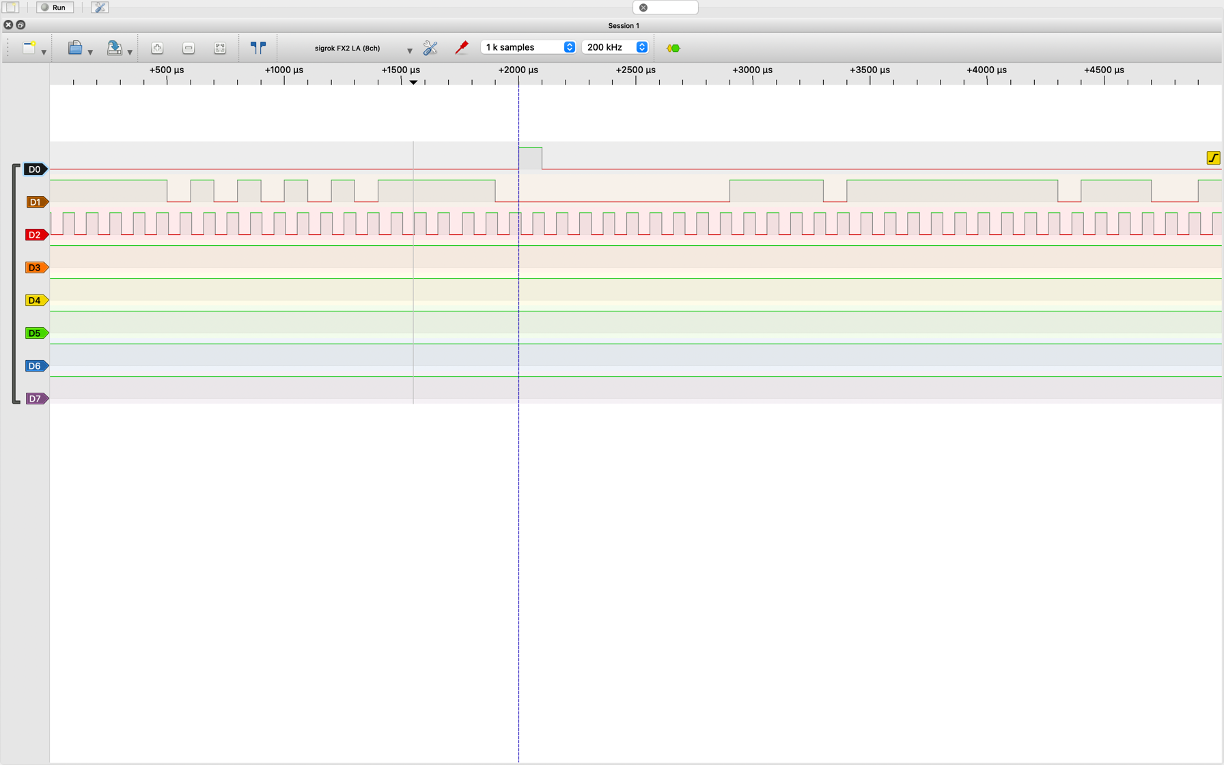
Now when you run, the system may not capture right away...it is waiting for the trigger event to happen (the rare signal rising from 0 to 1). When that happens it will do the capture:
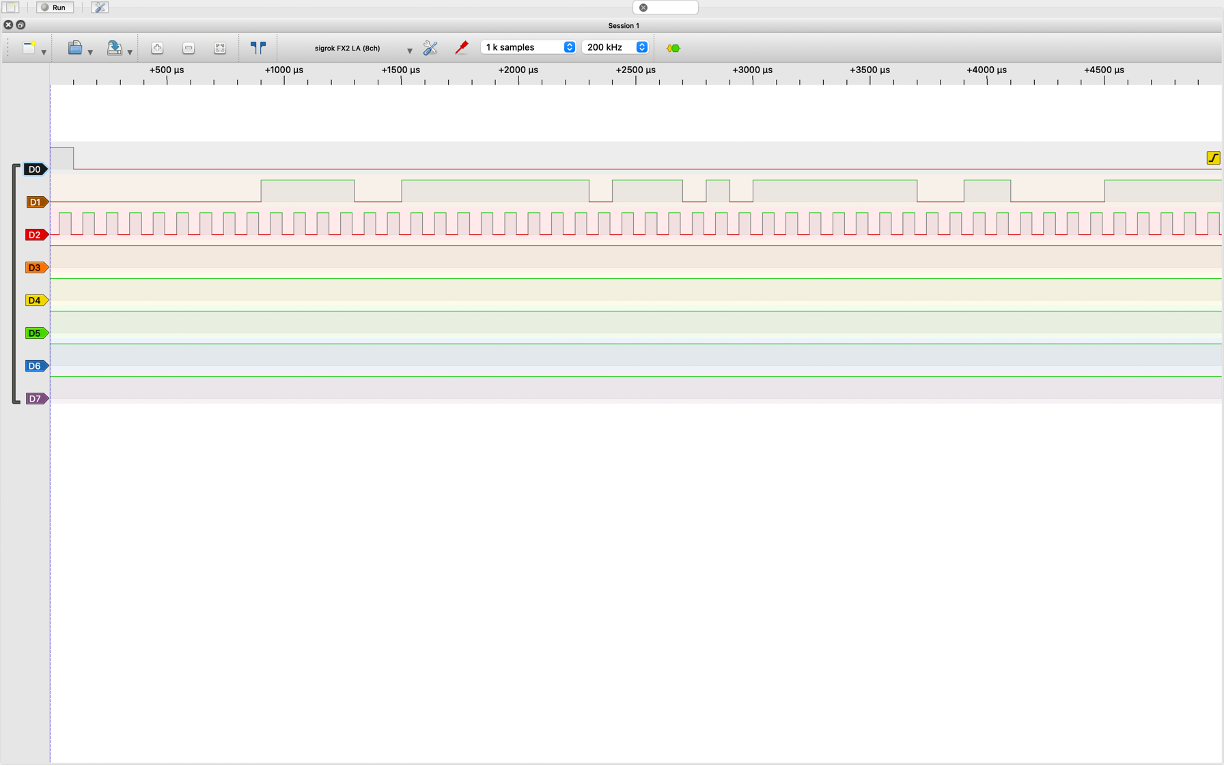
Under the settings option, you can change what is called the Pre-trigger capture ratio. What this refers to is insteady of the capture starting right when the trigger event happens, it will depict a certain amount before it too. So a setting 40% Pre-capture ratio like shown below...
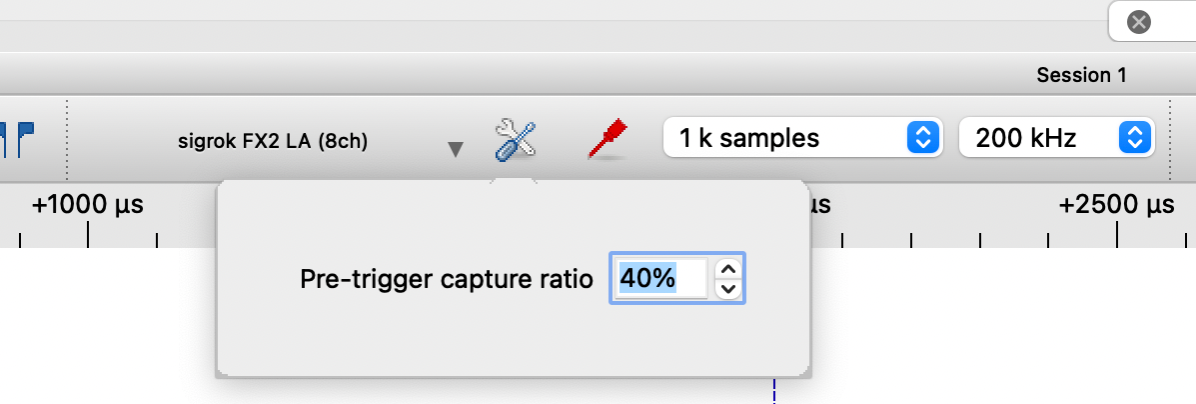
...will result in a capture with the trigger even more towards the middle of your capture space (and this can be helpful in meaasuring signals prior to the event you care about happening.)
